Sample Work

Analytical Portfolio

Selected graduate coursework demonstrating applied methods in molecular ecology, population genetics, and statistical modeling.

These samples are from graduate coursework at San Francisco State University, using datasets provided by the Cohen Lab, the Soria Lab, and the Swei Lab. They demonstrate my analytical approach and technical skills.

01

Course project — Molecular Phylogenetics

Phylogenetic Analysis of Leptasterias Sea Stars

I constructed maximum-likelihood phylogenetic trees using mitochondrial COI sequence data (both nucleotide and amino acid alignments) from brooding Leptasterias sea stars to investigate cryptic speciation and geographic population structure.

Methods

  • Multiple sequence alignment (ClustalW)
  • Maximum likelihood tree inference (GTR model for DNA, WAG for protein)
  • Bootstrap support analysis (100 replicates)
  • Tree rooting with outgroup (L. hexactis)
  • Clade identification and annotation
  • Isolation by distance testing (Mantel test)
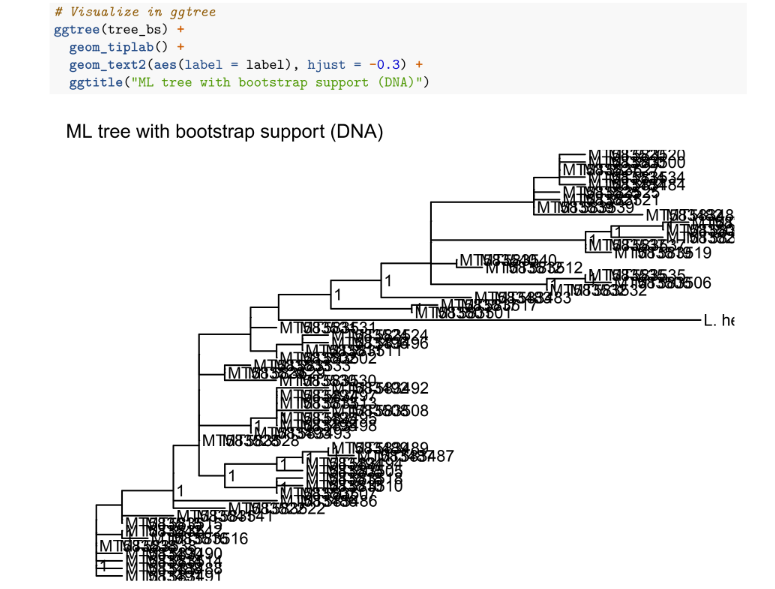
Maximum likelihood phylogenetic tree of Leptasterias sea stars with bootstrap support values shown at nodes, based on mitochondrial COI DNA sequences.
Figure 1. Maximum likelihood phylogenetic tree of Leptasterias sea stars with bootstrap support values (DNA data). Bootstrap values above 70% indicate strong support for clades corresponding to geographic regions.
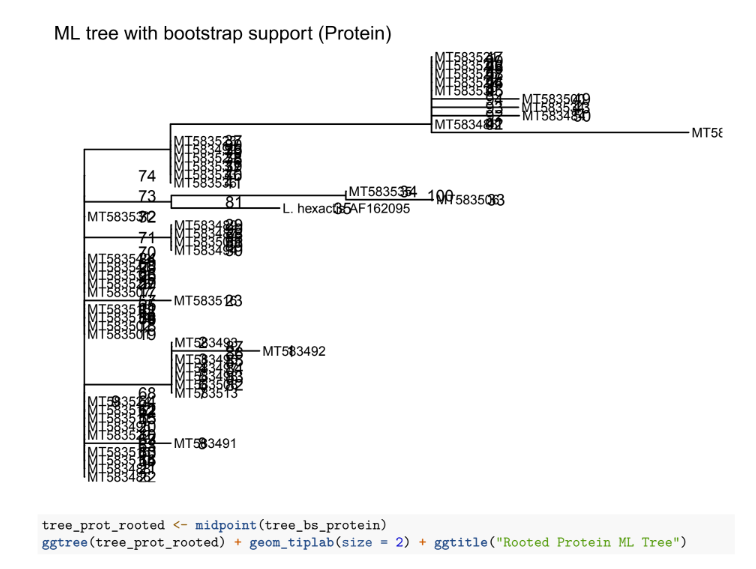
Maximum likelihood phylogenetic tree based on amino acid sequences showing consistent evolutionary patterns with the DNA-based tree.
Figure 2. Protein-based maximum likelihood tree of Leptasterias sea stars. The topology is broadly consistent with the DNA tree, strengthening evidence for cryptic species.

Interpretation

The tree revealed three well-supported clades corresponding to geographic regions, with strong bootstrap values (>70%). Both nucleotide and protein data showed consistent patterns of deep divergence, supporting the hypothesis of cryptic species within Leptasterias.

Molecular data analysisPhylogenetic methodsEvolutionary interpretationCryptic species detection

Supplementary Figures
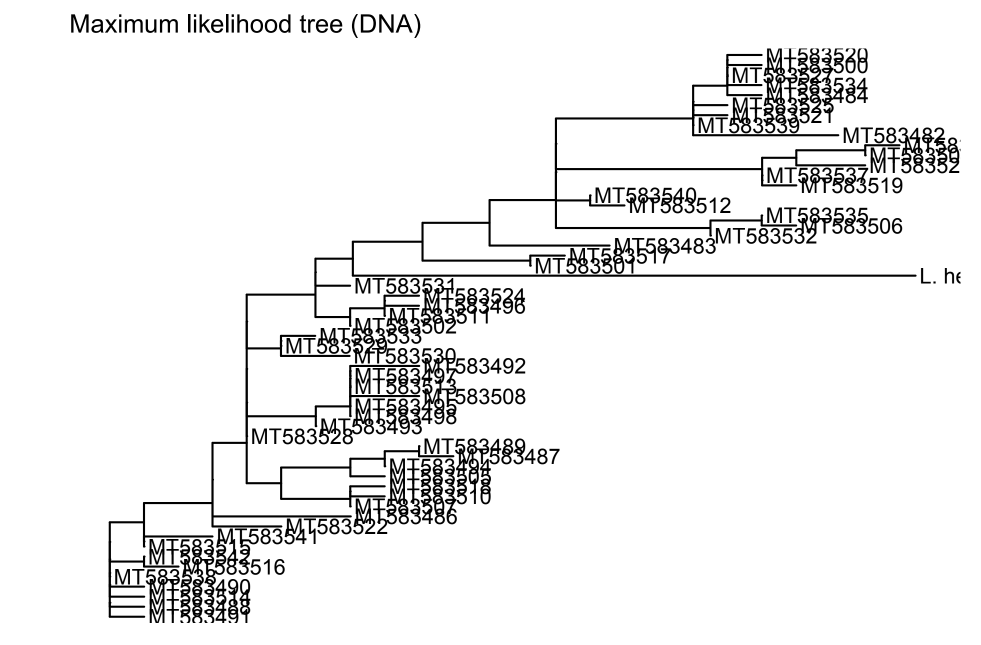
Maximum likelihood phylogenetic tree showing evolutionary relationships among Leptasterias sea star populations without bootstrap values.
Figure S1. Initial maximum likelihood phylogenetic tree of Leptasterias sea stars based on mitochondrial COI DNA sequences before bootstrap support was added.
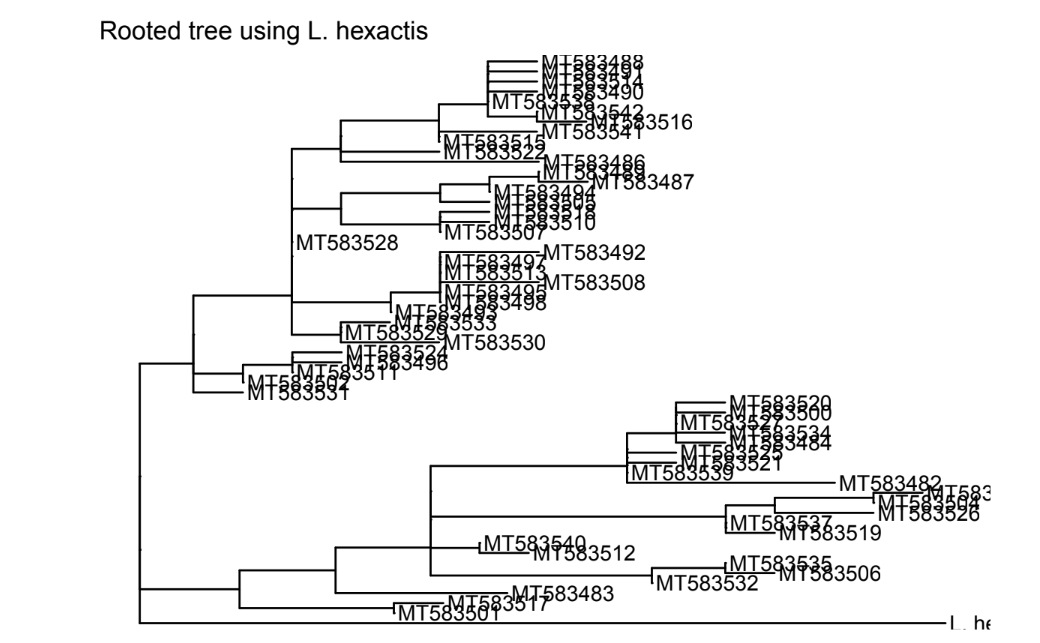
Rooted phylogenetic tree of Leptasterias sea stars with L. hexactis as the outgroup.
Figure S2. Rooted phylogenetic tree using L. hexactis as the outgroup. Rooting shows directionality and confirms the placement of L. aequalis specimens in the ingroup.
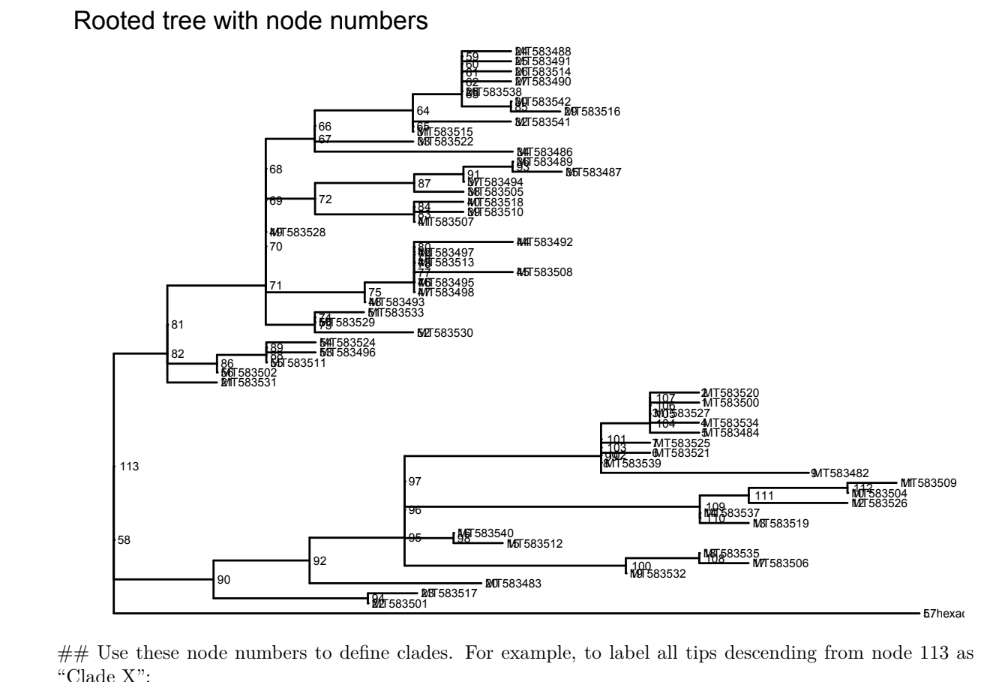
Rooted phylogenetic tree with internal node labels showing the structure used for clade identification.
Figure S3. Rooted phylogenetic tree with internal node numbers labeled. Node numbers were used to identify and define major clades for annotation.
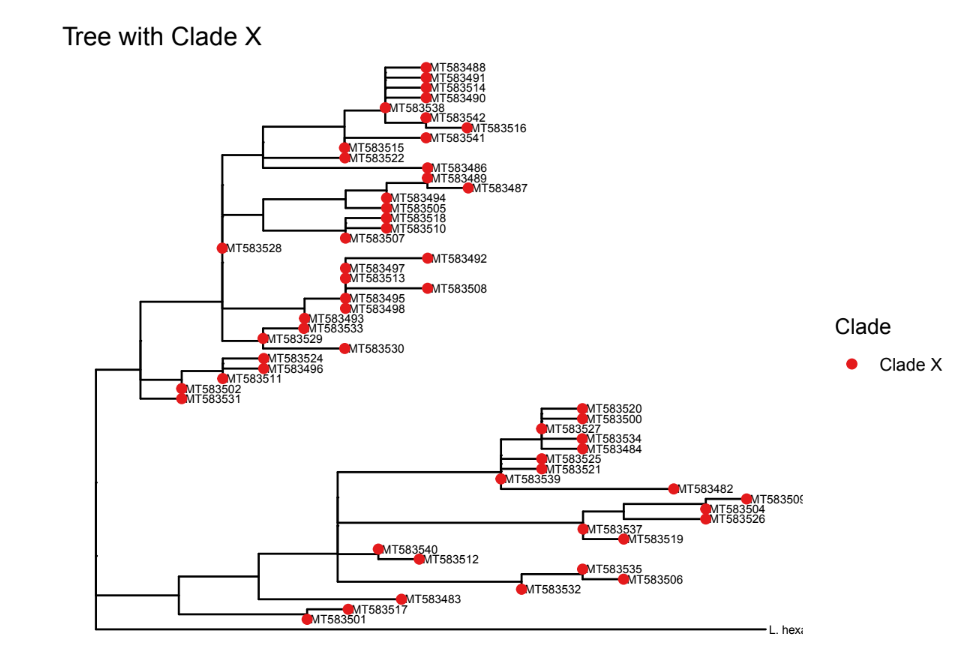
Phylogenetic tree with red dots marking tips belonging to Clade X.
Figure S4. Phylogenetic tree with Clade X highlighted in red. Colored annotation demonstrates clade identification and visualization.
02

Course project — Population Genetics

Population Genetics and Spatial Structure in Dusky-Footed Woodrats

I analyzed SNP genotype data from dusky-footed woodrat populations across California to test whether genetic differentiation increases with geographic distance (isolation by distance).

Methods

  • VCF file processing and genind object creation
  • Observed vs. expected heterozygosity calculation
  • FST calculation (per-locus and global)
  • Genetic and geographic distance matrices
  • Mantel test (999 permutations)
  • PERMANOVA for regional differentiation
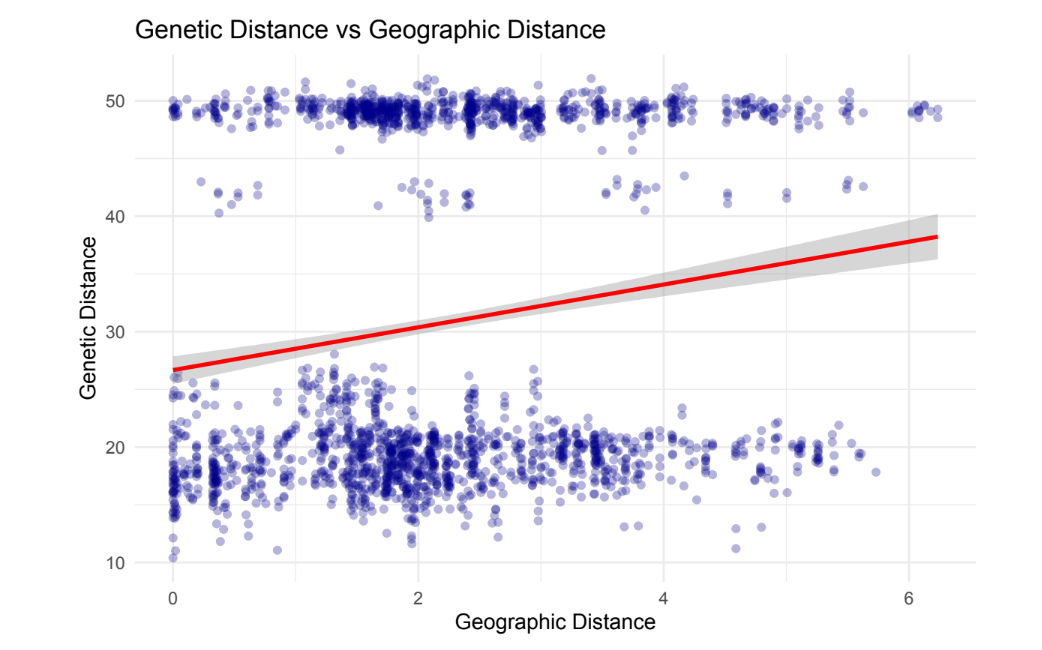
Scatterplot of genetic distance versus geographic distance across dusky-footed woodrat populations, with a red regression line and gray confidence band showing a significant positive correlation consistent with isolation by distance.
Figure 1. Genetic distance vs. geographic distance — scatterplot with regression line showing a significant positive correlation (Mantel test: r = 0.16, p = 0.004), consistent with isolation by distance.

Interpretation

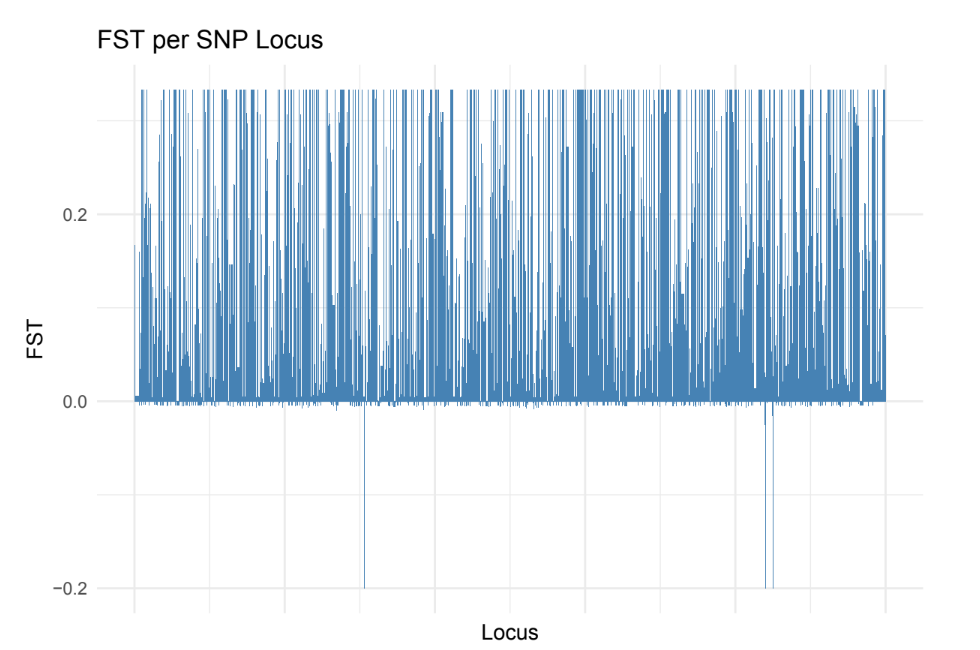
The Mantel test showed a significant positive correlation (r = 0.16, p = 0.004) between genetic and geographic distance, consistent with isolation by distance. Most loci showed low FST, but a few loci had high FST, suggesting possible selection or historical structure.

Population geneticsSpatial analysisStatistical testingEcological interpretation

Supplementary Figures

Bar plot of FST values per SNP locus across dusky-footed woodrat populations, showing most loci near zero with a few elevated outliers.
Figure S1. FST per SNP locus — bar plot showing FST values across loci. Most loci show low differentiation, with a few loci showing elevated FST.
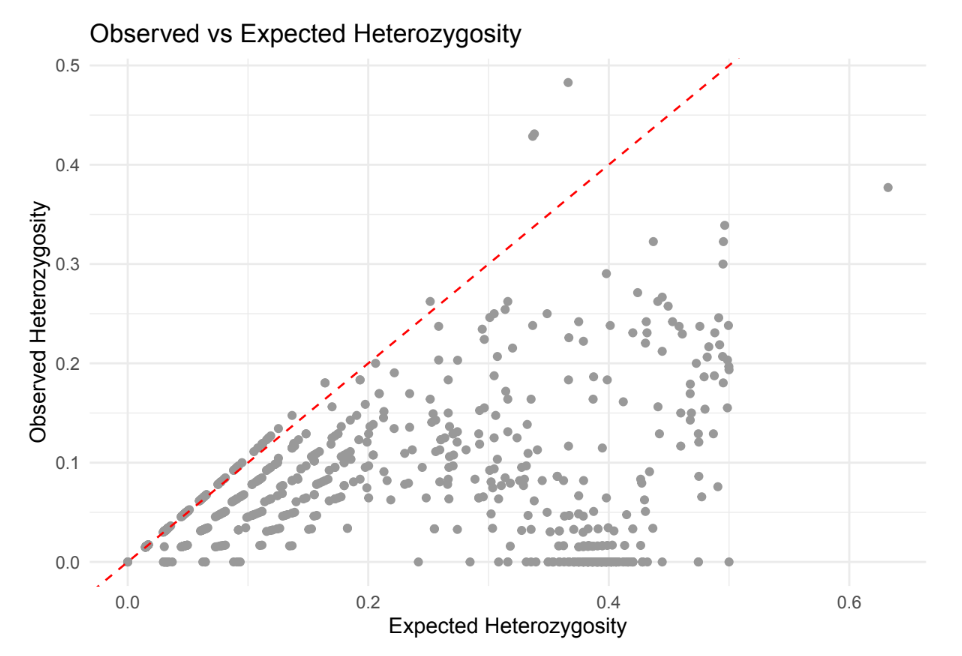
Scatterplot of observed versus expected heterozygosity across woodrat SNP loci, with a red dashed Hardy-Weinberg equilibrium reference line; most points fall below the line.
Figure S2. Observed vs. expected heterozygosity — scatterplot with red dashed line indicating Hardy-Weinberg equilibrium. Most loci fall below the line, indicating a deficit of heterozygotes.
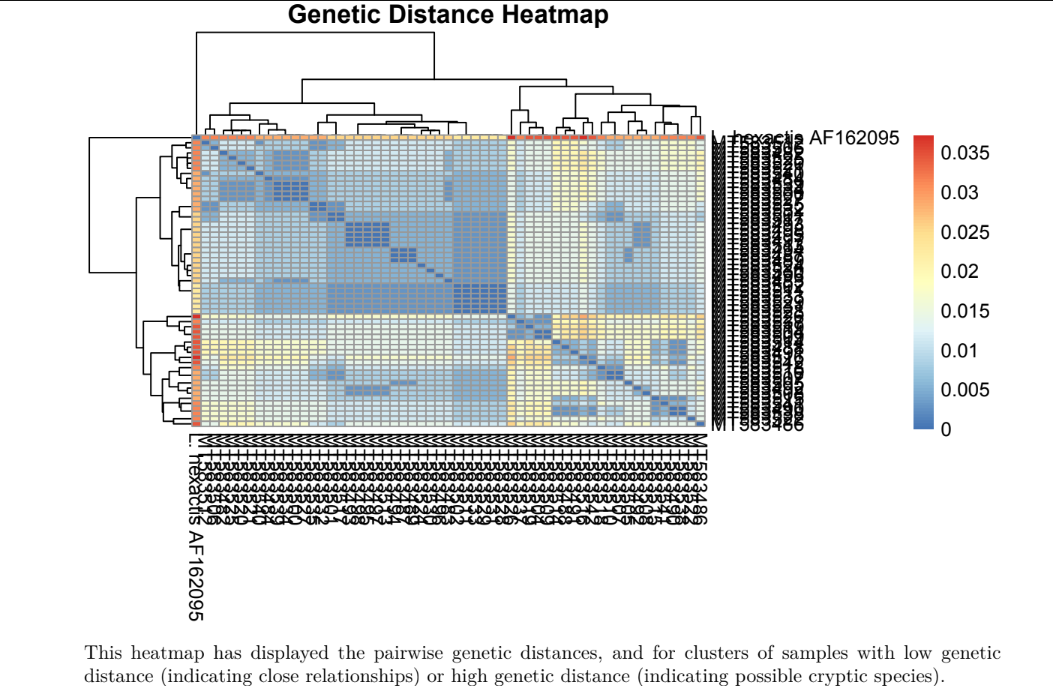
A heatmap visualization displaying pairwise genetic distance matrix with a clustering dendrogram, showing blocks of low and high genetic differentiation.
Figure S3. Genetic Distance Heatmap showing pairwise genetic differences among samples. Clusters of similar colors indicate closely related individuals, while contrasting colors highlight genetic divergence.
03

Course project — Advanced Statistical Modeling

Generalized Linear Models for Tick-Borne Disease Ecology

I used generalized linear models (GLMs) and generalized linear mixed models (GLMMs) to test how rodent diversity and predator diversity predict the density of Borrelia-infected ticks in Northern California forest fragments.

Methods

  • Poisson GLM fitting and interpretation
  • Model comparison with AIC
  • Diagnostic plot assessment
  • GLMM with random effects (Site, Year)
  • Ecological interpretation of coefficients
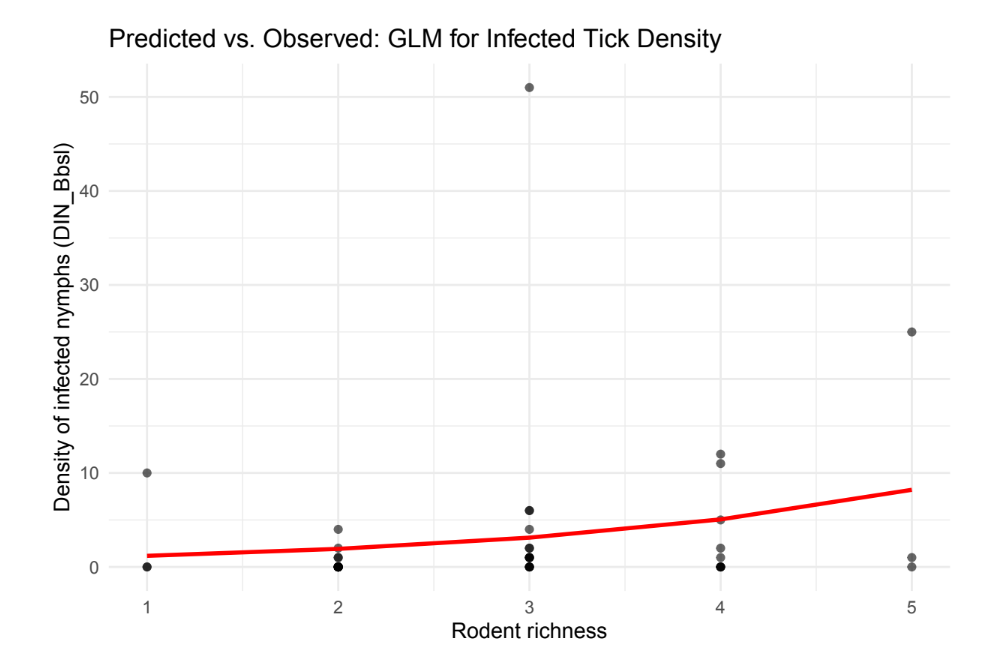
Scatterplot of predicted versus observed infected tick density values from the Poisson GLM, with a red regression line.
Figure 1. Predicted vs. observed: GLM for infected tick density — points with red regression line.

Interpretation

Rodent richness was a significant predictor of infected tick density (p < 0.001), with each additional rodent species associated with a 62% increase. Including predator diversity improved model fit (AIC decreased by ~8.6). Site and year random effects substantially improved the model, indicating that local conditions strongly influence tick density.

Statistical modelingModel selectionEcological data interpretationMixed-effects models

Supplementary Figures

Figure S1. Model diagnostic plots — Residuals vs Fitted, Normal Q-Q, Scale-Location, Residuals vs Leverage. The plots show that most data points fit well, though points 3, 20, and 27 stand out as outliers.
04

Course project — Experimental Design & Statistics — Experimental Design & Statistics

Experimental Ecology and Two-Way ANOVA in Fiddler Crabs

I used a two-way analysis of variance (ANOVA) to test whether body size interacts with sand hydration state to influence the thermal preferences of male fiddler crabs. The analysis assessed main effects and interaction terms, followed by Tukey post-hoc comparisons.

Methods

  • Bartlett's test for homogeneity of variances
  • Two-way ANOVA (main effects and interaction)
  • Tukey HSD post-hoc multiple comparisons
  • Model diagnostic assessment (Residuals vs. Fitted, Q-Q, Scale-Location, and Constant Leverage plots)
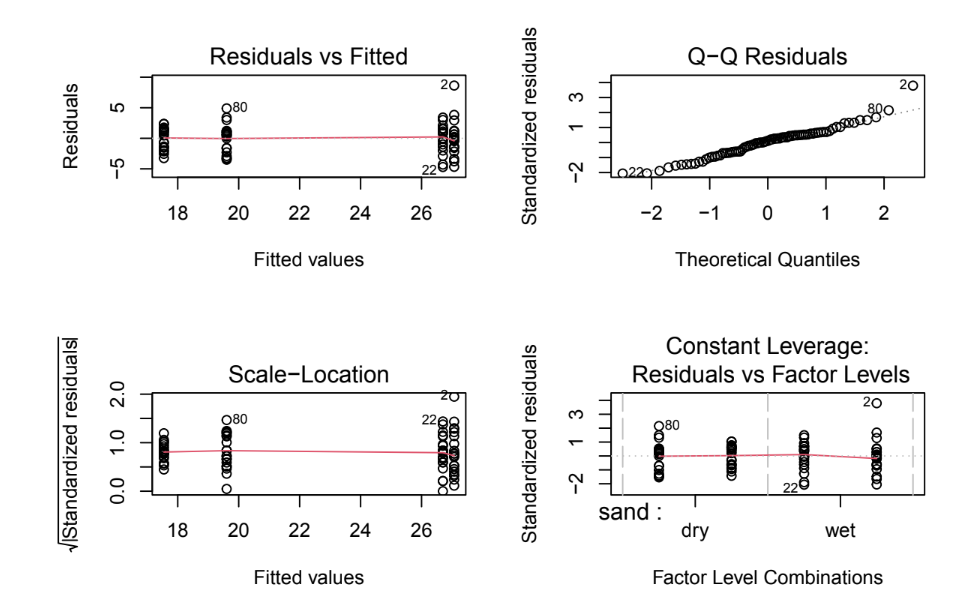
Four diagnostic plots for a two-way ANOVA model showing residual distribution, normality, variance, and leverage.
Figure 1. Model diagnostic plots (Residuals vs. Fitted, Q-Q, Scale-Location, and Constant Leverage) for a two-way ANOVA assessing the interaction between sand hydration and crab body size on thermal preference.

Interpretation

The analysis revealed that sand hydration state significantly affects crab body temperature. However, body size did not have a significant main effect, and the interaction between sand and size was marginal (p = 0.097). Diagnostic plots confirmed that the model residuals generally followed the assumptions of normality and equal variance, with a few acceptable deviations in the tails.

Experimental designFactorial data analysisANOVA modelingPost-hoc testingModel assumption checking

Ecological Taxonomy Research Consultancy LLC

Marine & Environmental Data Analysis

MSc Marine Science — open to research partnerships, collaborations, and consulting engagements.

Get in Touch

haak@ecotaxonomyresearch.com

Available for research partnerships, data analysis projects, and scientific consulting.

Start a Conversation

© 2026 Ecological Taxonomy Research Consultancy LLC. All rights reserved.

Marine & Environmental Data Analysis